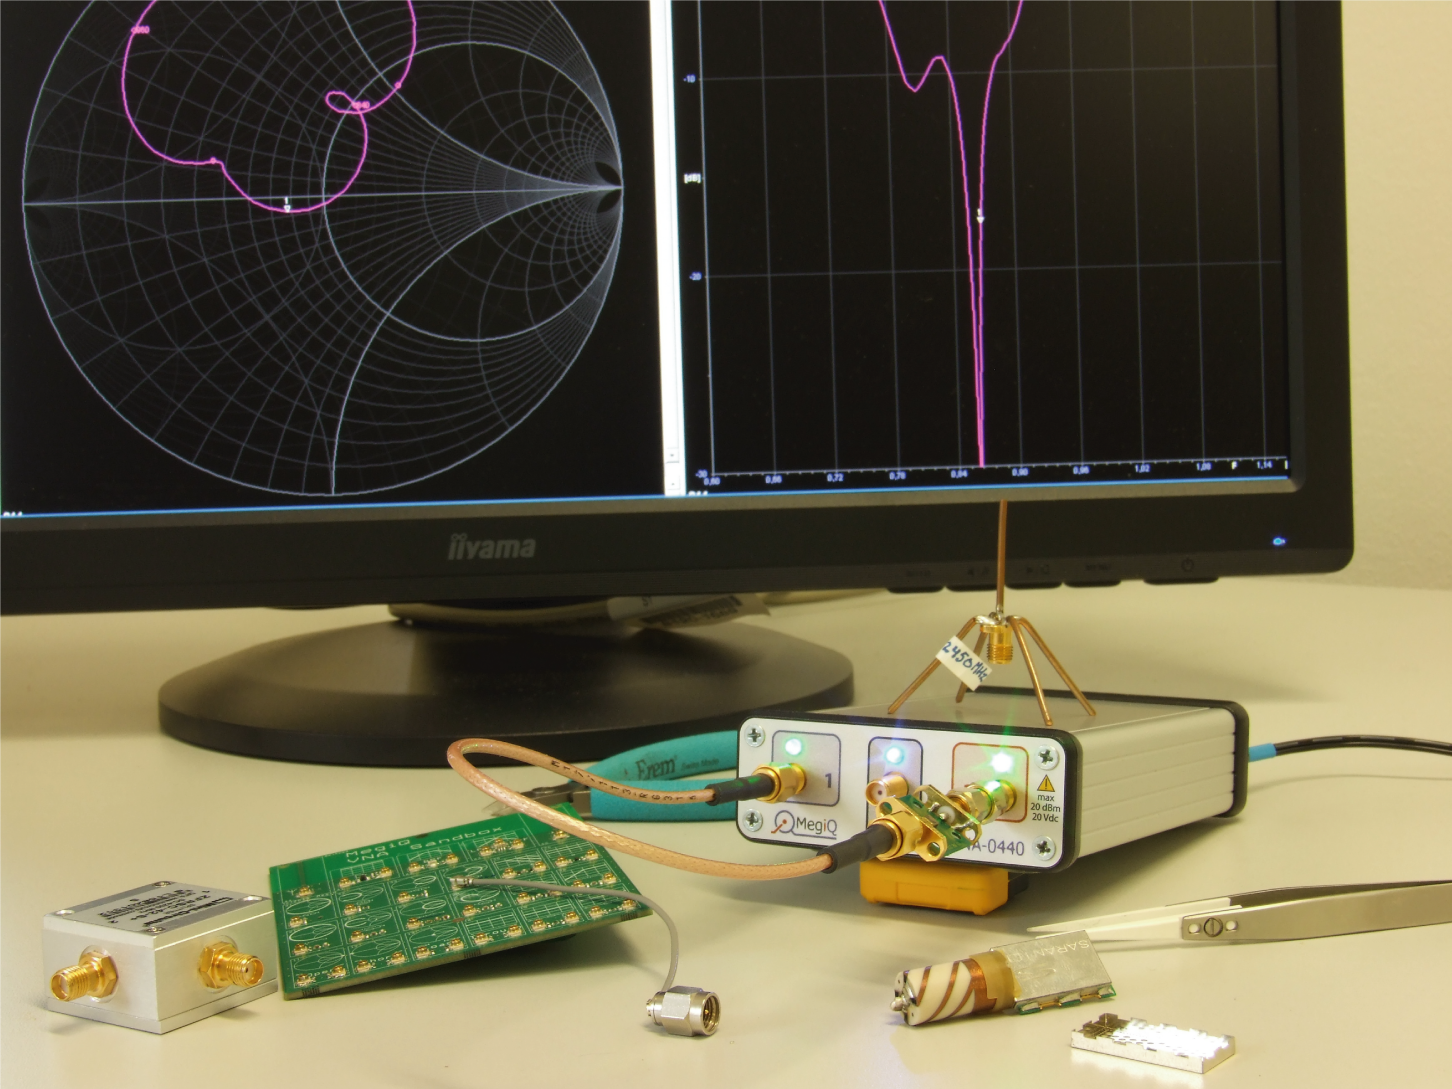
A VNA (Vector Network Analyzer)?is a very useful instrument for the IoT M2M hardware developer, because it helps you to measure and to check the most important part of the hardware design – the antenna and is transmission lines. It is one of those tools you do not know you are missing until you’ve got one. One that will save you a lot of time solving problems you are even not aware of, but that can have a serious impact on the quality of your design, like unnecessary high? battery drain, malfunction, impaired range…
It measures complex (transfer) impedances of 1-port (and depending on instrument also on 2-port networks) And RF is all about ?matching impedances? and ?getting networks to work together?, so you can imagine that a VNA can save you really a lot, lot of time.
But until recently VNAs costed a lot of money, like starting at 20K Euro, not the amount of money your manager would spend if you can not promise in writing it will save him or her money.
The good news is that those instruments are available now well under 5000 Euro,? suddenly a lot of RF-engineers start looking at them as a tool they can really afford.
Therefore? this chapter on usability for those RF design engineer, specially engineers designing the bulk of today electronics: consumer electronics and industrial electronics in IoT and M2M. This chapter will compare VNAs for lab table use going up to at least 3 GHz and covering the most used frequency bands in use for wireless IoT M2M devices (e.g. NFC 13.42 MHz, GSM at 900/1800 MHz, UMTS at 2150 MHz, Bluetooth at 2450 MHz) in the price range under 5000 Euro.
5000,- because under that limit you often do not need to walk all the way up to the CEO to get approval. (and which will be very difficult to explain to someone not involved with RF)
Still, we included a VNA from R&S not because it is a very low cost unit (around 20.000,- Euro), but just because R&S is well settled when it comes to RF-T&M gear.
Well to be honest in fact it is the low-cost R&S table top solution. Which shows low-cost is relative.
Comparision of three VNA:
- mRS: miniVNA-Tiny (aprox 430 Euro, 1 … 3000 MHz)
- MegiQ: VNA-0440 (2900? Euro, 400 … 4000 MHz)
- Rohde & Schwarz: ZVL6 (20.000 Euro, 9 kHz … 6000 MHz)
Conclusion
mRS miniVNA Tiny: cheap, low quality; just useful for the radio amateur who has patience and expertise to interpret results. Phase information not very useful in VHF and UHF range.
Rohde & Schwarz ZVL6: Professional quality, all round VNA, rather difficult to operate, very expensive.
MegiQ VNA0440: Professional quality, for the RF designer, easy to use, low priced.
General overview
MegiQ: For a few thousand Euro the MegiQ solution is a bit out of the budget of most radio amateurs, but seen the performance it is a very nice instrument for the professional. Also the frequency range, 400 MHz – 4 GHz is targeted at professional use in design of the consumer electronics of today. But as a design engineer I am interested in that range of 400 – 4000 MHz and within this frequency band we found the unit to give results comparable to the Rohde & Schwarz unit at a fraction of the costs; really amazing.
Operation is easy and straight forward, and it has a lot of unexpected extras.
miniVNA: Nice thing is that you get coverage up from 1 MHz up to 3 GHz for very little money. But of course, for the price you can not expect a lot. The miniVNA looks and feels like a solution for the radio amateur. Advantage is that it is light and really tiny.
It is sensitive to warming up so you need to switch it on timely. It is useful for measuring scalar parameters, like of Return Loss and SWR. It is incredibly noisy and not useful at all for any measurements where phase is involved, so if it comes to phase measurement it is not really a vector network analyser. Yes, it can display a Smith Chart, but as an engineer I would not dare to really develop circuits based on those noisy measurements. It is maybe more a kind of scalar network analyser than a vector network analyser. And then a spectrum analyser with a tracking generator is maybe the better solution.
Rohde & Schwarz: If you go for general specs, the R&S is the best, but well, you can buy a nice car for that money. The fFrequency range is 9 KHz up to 6 GHz, it is a two port VNA. It is a one box solution, so with display and knobs on the front panel, but it is impractical to work with without external mouse and keyboard. It ?feels? like a German car, it is sturdy. But it is also heavy and bigger than the other solutions, which can be an disadvantage in some occasions. For me that is travelling around and is testing antennas in customers office, this heavy machine is a no go. The results are what you would expect from a 20.000 Euro machine, but front panel operation is cumbersome and very confusing.
operation
MegiQ: The instrument is controlled over USB by a desktop user interface that gives a good overview of measurement results, settings, saving/recalling. Operation is intuitive even with the many features, like stepping through bias voltages in multiple sweeps, automatic calculation of matching networks, etc.
The MegiQ user interface is by far the most pleasurable to work with. The manual gives a good overview but you will hardly need it.
The instrument is running under Windows XP, 7 and 8 and there are people using it on an Apple computer.
Their web site says: ?designed by and for RF-engineers?, and I got impression that the user interface has really been developed in close cooperation with actual RF-engineer users.
It remembers where you left while closing the application, so when you start again you do not need to choose all those parameters again. The Session Manager is a very powerful but simple tool to group, save and recall your work:? graphs, instrument settings, measurement data, calibration data, etc. I met the developer at an exhibition in Appledorn. They spend two hours to educate me and we measured some PCB antennas with coaxial cables together.? Just to let you know, that the out of the shelf antennas was resonate on frequency range and/or showed a poor return loss as well. The MeqiQ VNA is designed by engineers that has to develop RF circuits and antennas daily. They developed a tool including accessories like the ?sandbox? and help engineers with skills in electronic to design RF electronic. They help not just with a good VNA – they help with some documentation and accessories (sandbox) for self-education. If you combine it with the free of charge software Atyune, then you get a very powerful combination. With the MeqiQ VNA you measure the antenna, store the Touchtone file to your laptop, load it to Atyune and calculate the matching circuit by mouse click.
miniVNA: At first glance at the user interface you get an impression of the instrument, but if you look closer, it is not that obvious what the state of the instrument is. Does not look like one consistent program, but more like loose parts working together. If you e.g. want to see the Smith Chart, it opens in a different window and disappears to the background every time you hit the sweep button. And then you must save it using the ?gif? button on the graph, A complete different procedure from saving the Return Loss graph -it is confusing If, after performing an OSL calibration, you forget to hit the knob to actually use that calibration, you can start over again; and calibrating is really slow. The advantage is that the software is in Java and will run without installation. The three helical antennas tested and listed in former chapter I measured with the miniVNA. The result is on the server for download. At the scalar parameters VSWR and Return Loss the mniVNA shows a nice graph, but if you switch to Smith Chart, then you can detect that the graph is jumping around wild. If you then try to optimise an cellular PCB antenna shape multi resonate in GSM 850, 900, 1800, 1900 and UMTS 2150 then you will detect that the Smith Chart is cycling around in several time, what is common and necessary and on top the graph is jumping as well.
Rohde & Schwarz: The instrument is normally controlled on the front panel although there is the possibility for remote control. To use it without a mouse and external USB keyboard is not easy.
It runs under windows, but the controls to access features like saving pictures (and where they actually go) are very difficult to find. Perhaps somewhere in the hundreds of pages of manual.? And there are only two USB ports, so when using a keyboard and mouse, where does the memory stick to save the pictures go then…
There are a lot of features, and the push buttons an context sensitive menus that pop up on the side of the screen are not very intuitive (and that’s an euphemism), so setting up the instrument before you can make a measurement is a tedious job. A seasoned RF engineer had to ask a colleague using the instrument daily for clues how to operate it. Myself got lost. There are to many buttons on the front panel and there are to many pages to read.
But of course once set it works fine. The problem is that when you switch the instrument off, it looks like it got a complete amnesia and next time you start it up, it comes back in an complete other mode, other frequencies, etc. Sure there must be a setting for the defaults somewhere, but I could not find it. The transmission line and the antenna in a IoT M2M device are the most important part, but the time you spend to get a VNA up and running has to be realistic.
Yes it is a nice instrument, but for the price it costs you would expect a better user interface, one that is designed in cooperation with engineers who really have to use ?the instrument daily.
Graphical presentation of results
Besides the ?technical specs?, graphical presentation of the measurement data is of importance. If you are doing a lot of measurements a day you want a display that gives overview and in depth information in one glance. And if you are only making a measurement every now and then, you want something easy interpretable.
MegiQ: The MegiQ user interface is far out the best when it comes to graphical presentation of the results. You are completely free to arrange all kinds of graphical representations of the measurement data on the screen. And it is easy to do. And if you save and then recall a measurement, you can still rearrange the graphs, switch markers on and off.
While making settings, the displayed measurement stays visible.
The graphs are easy interpretable, also after you print them, since beside markers (and yes, after printing it on paper you cannot change them…hi) there are labels along the trace lines. So also after printing a Smith chart, you can still see at what frequencies you are looking along the trace. Amazing that nobody else does this, even not the very expensive R&S.
miniVNA: You have one graph to display the results. You can choose what parameter you want to display in that graph, except the Smith Chart. For this there is an extra graph, but that one disappears to the background every time you hit the sweep button. It was not easy to set multiple markers. The software for miniVNA is a freeware by third party.
Rohde & Schwarz: Without an external screen, the graphical presentation is a bit messy. The screen is too small to display multiple graphs in a useful way.
Save / recall
MegiQ: If it comes to saving and recalling your work, setting etc, the MegiQ solution is the most powerful and at the same time the easiest to operate. It has a Session Manager where you group your settings, measurements, calibration tables in a very simple way and then save those groups in Session Files. For example a file for each project, or a file for each kind of measurement.
So you do not save a ?picture? but the complete state of the instrument together with the measurements. From there you can of course choose to export the data in other formats to integrate in your report. But the big advantage is that when you want a different graph on the same data, or reposition the markers a week later, you can still do that (since you have the the complete dataset at hand and get it back into the instrument) and then export it to your report.
The MegiQ VNA was from beginning planned to be connected to a laptop/PC and is using all? benefits that you can expect on a PC based VNA. Really everything and any data including the settings are saved in one file. The measurement data, the markers, the calibration of the VNA are stored together. If you power it of on Friday you just power it on and load on Monday and can go ahead without to loose time.
miniVNA: There are several ways to export measurements, but is is not in a structural way. So you can export e.g. to excel, csv, pdf, jpg, … but that are all separate files, so you got to remember very well what went where…
Rohde & Schwarz: Very unclear what you are saving where. If you look it up in the manual, you can do it, but one month later I had really forgotten how and had to solve the puzzle again. You can save the actual data and recall it, but it is cumbersome and you need to go through different menus for that. Remember that the first Rohde & Schwarz VNAs was stand alone machines without interface to a laptop. Later on they got interfaces for floppy disks.
Exporting
MegiQ: You have a print button that easily saves the measurement with a comment to EMF, which is a standard vector format, so you can scale it in your report without losing resolution.
It uses the graphical representation you had put on the screen, so the combined graphs and markers, the complete overview you had in mind for the measurements. You can recall previous measurements, change the graphical representation, add markers, etc. and then again export the results.
A method to export the graphs individually, is to use the right mouse button and copy&paste the individual graphs into an other application, like Office.
Exporting the measurement data in Touch Stone format is easy too, to import it in Excel or directly into your favourite RF simulation package. (there are three columns: freq, real and imaginary impedance)
miniVNA: You save the Return Loss graphs separately from the the Smith Charts. The latter can only be saved as a GIF. For the Return Loss graphs I had to rename the graphs in Windows every time, which is tedious. There is also the possibility to save the RL graph in a PDF, but you can not manage to combine the RL Graph with the Smith chart in one file for easy reporting. Truly spoken I export Touchtone and import it to Atyune. Atyune is much more handy what is logical because the developer of the software is developing embedded antennas daily.
Data can be exported in Touchtone (SP1), CSV, Excel or XML format.
Rohde & Schwarz: Of course you can export in all kind of ways, but each cumbersome: a lot of menu’s to go through, and hard to remember one month later. It is just not obvious. I’m happy I could get the graphs out of the instrument in order to use them in this report, but I had to ask someone who is using the instrument daily. For my daily job it is not just to expensive, it is not very user friendly as well. If you do not use it daily, then you will forget fast how to use it.
Some actual measurements
Of course in the end it is very important that the instrument really does the job, so we compared two simple RCL circuits, both on all three VNAs.
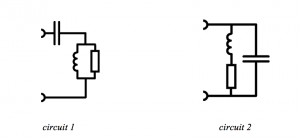
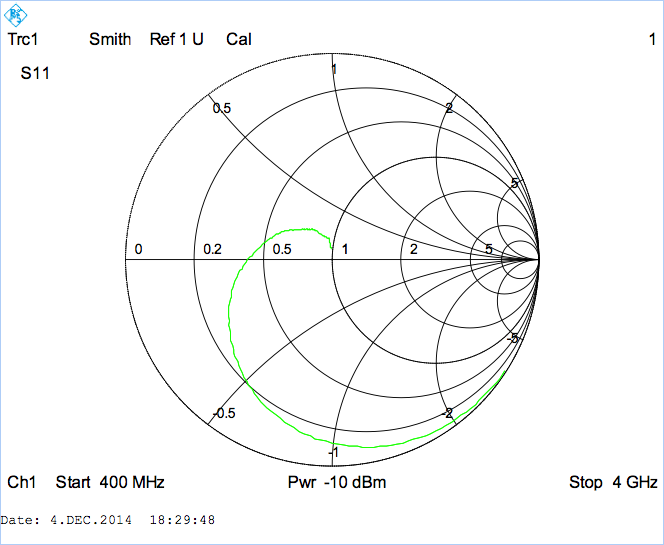
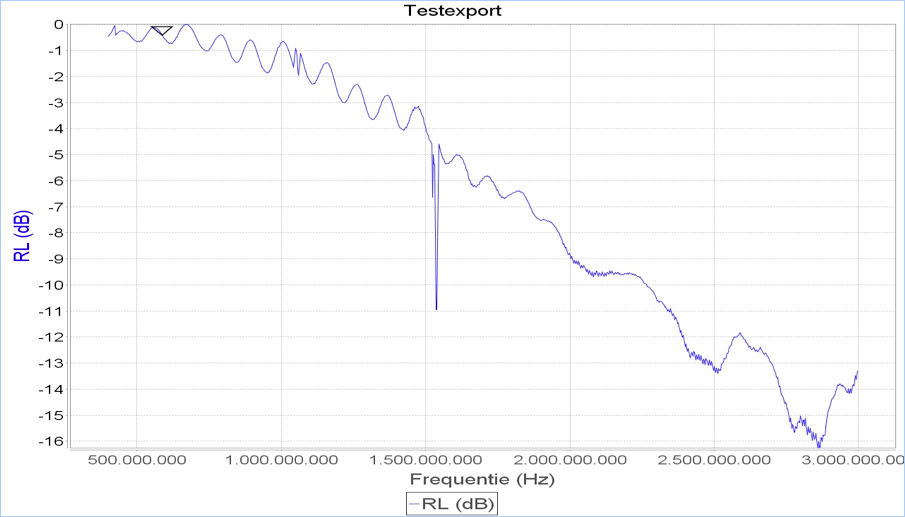
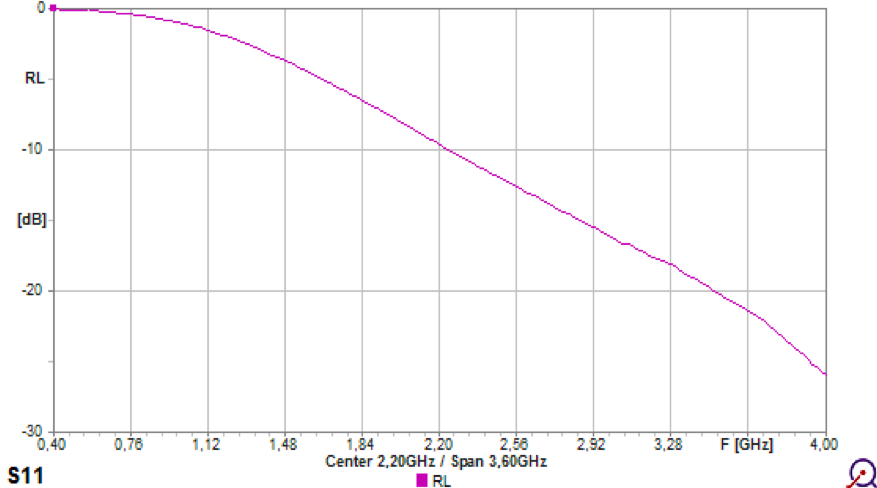
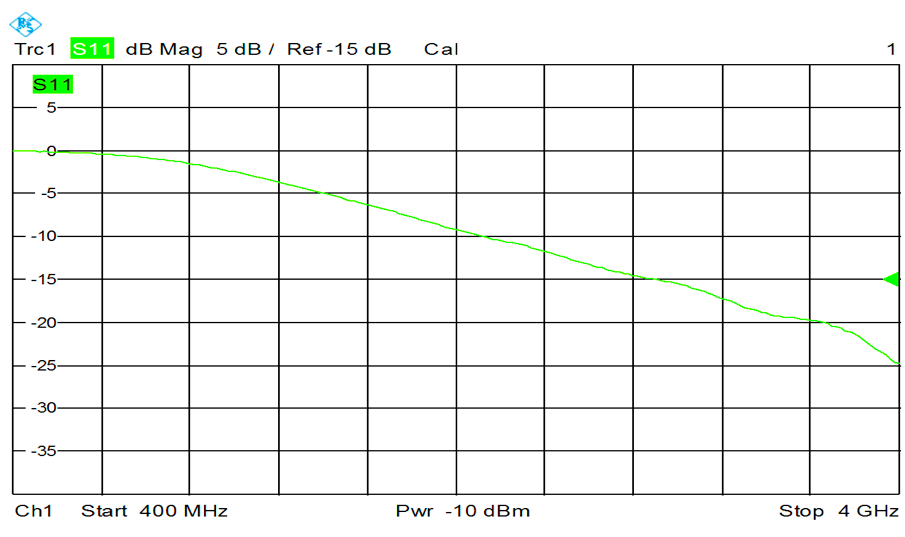
We will show graph of the Return Loss and a Smith chart.
miniVNA: When we see the Smith chart from the miniVNA we see it is very noisy and it only gives an indication of the impedance at best. As a ?plus? you get spurious peaks, which are rather annoying: they are around the GPS frequency band.
As with the R&S, (and many others) you can not see from the plot at which frequency you are looking (only start and stop freq are clear). During the measurement you can put markers, but once printed you can only guess.
The Return Loss plot looks more useful, although it is rather ?bumpy?. You do not see those bumps with the MegiQ and the R&S. The line should be smooth.
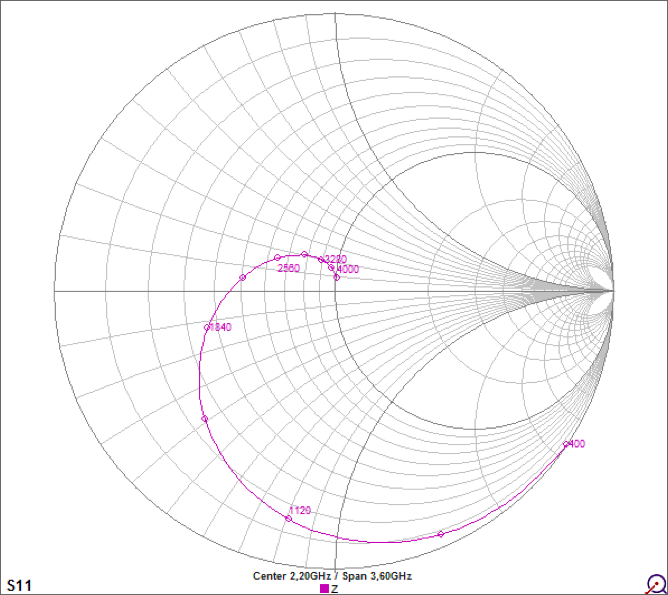
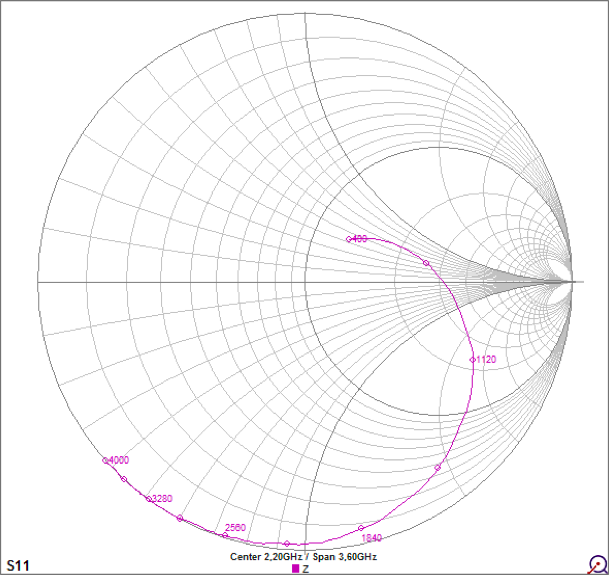
MegiQ: A very clean Smith chart, very comparable to the data out of the R&S box.
In one glance you now realize the advantage of the labels along the trace: you see where you are about, also after saving it into a report!
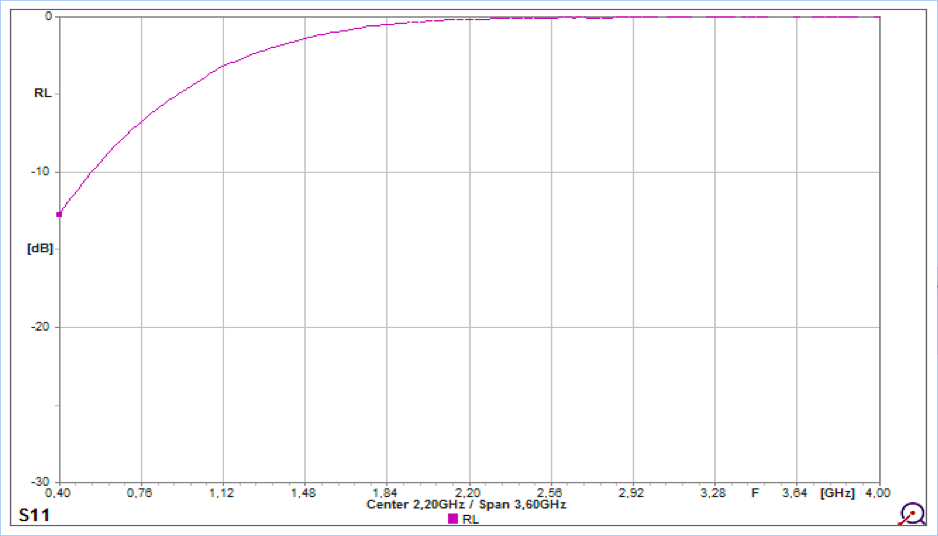
The Return Loss plot looks nice, and gives the same results as the R&S VNA. No artefacts (bumps) that should not be there.
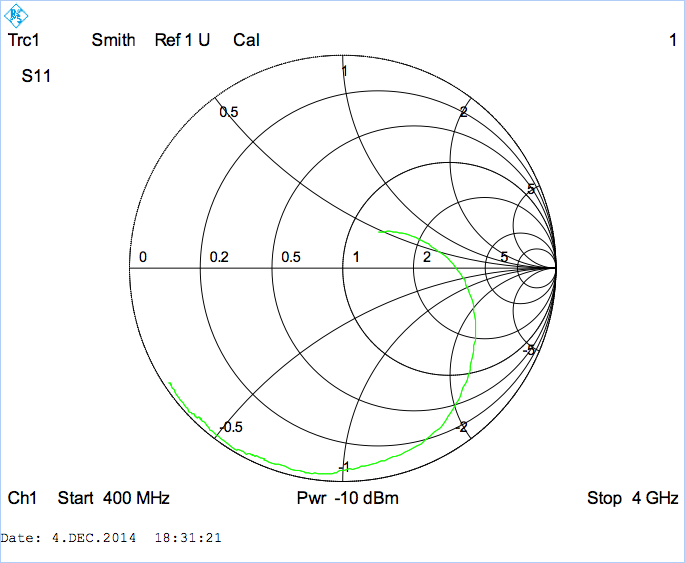
R&S As you would expect from R&S a clean Smith chart, comparable to the MegiQ graph. However to interpret the data after saving the picture is not very easy, since we only know the start and stop frequency. Looking at one point on the trace, you must make a very rough guess at which frequency you are looking: There are no frequency labels along the trace.
The Return Loss plot looks nice, and gives the same results as the MegiQ VNA.
Let the graphs on the next pages speak for themselves…
LCR circuit 1:?
This is a capacitor in series with an inductor shunted with a resistor.
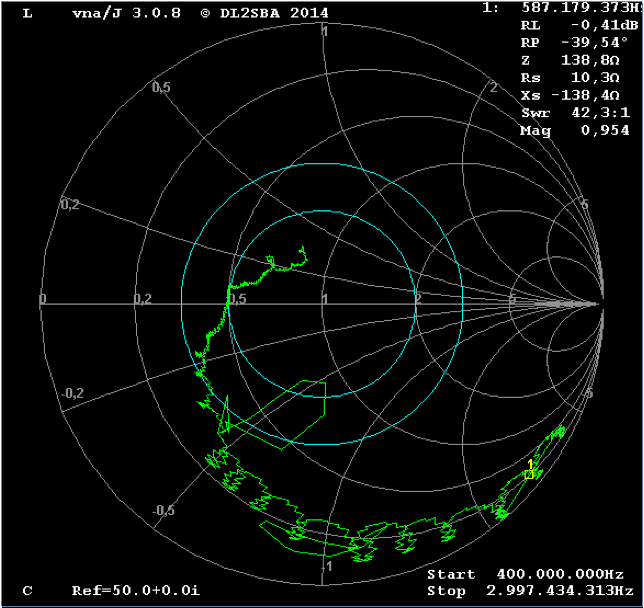
tinyVNA:?400 … 3000MHz ? ? ? ? ? ? ? ? ? ? ? ? ? ? ? ? ? ? ? ? ? ? ? ? ? ? ? ? ? ? ? ? ? ? ? ? ? ? ? ? ? ? ? ? ? ? ? ? ? ? ? ? ? ? ? *note the graph is very noisy, and only gives an impression of impedance.
MegiQ:?400 … 4000MHz
R&S ZVL6:?400 … 4000MHz
LCR circuit 1 (return loss graph)
miniVNA: ?1… 3000MHz
MegiQ:?400…4000MHz
R&S:?400…4000MHz
LCR circuit 2
This is a capacitor in parallel with an R and an L in series.?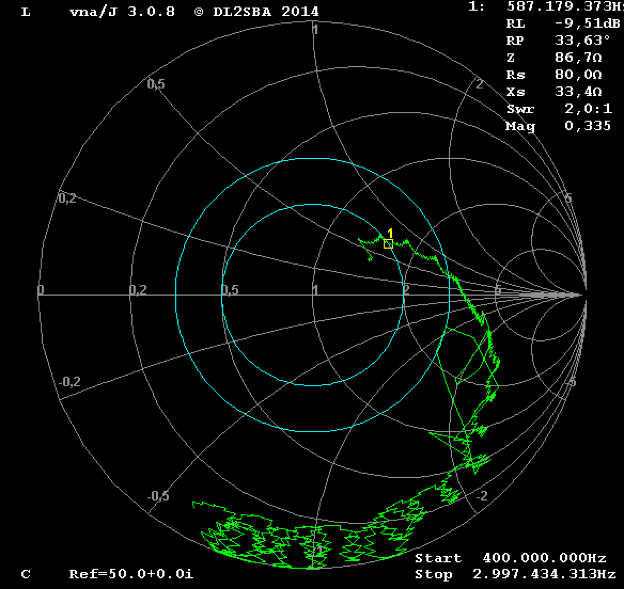
miniVNA, LCR circuit 2:?400…3000MHz ? ? ? ? ? ? ? ? ? ? ? ? ? ? ? ? ? ? ? ? ? ? ? ? ? ? ? ? ? ? ? ? ? ? ? ? ? ? ? ? ? ? ? ? ? ? *note the graph is very noisy, and only gives an impression of impedance.
MegiQ, LCR circuit 2:?400…4000MHz
R&S ZVL6, LCR circuit 2:?400…4000MHz
LCR circuit 2 (return loss graph)

miniVNA:?1…3000MHz ? ? ? ? ? ? ? ? ??(-12 … 0 dB)
MegiQ:?400…4000MHz
(-15 … 0 dB)
R&S:?400…4000MHz
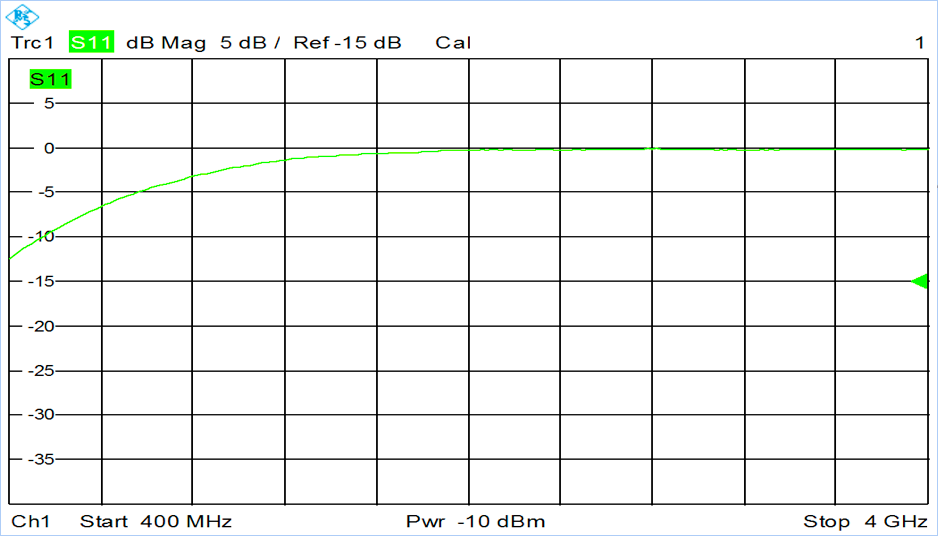
(-15 … 0 dB)
The MegIQ Vector Network Analyzer can also be compared to these popular models:
(Also see our calibration pricing at: www.Custom-Cal.com or call (908) 328 – 3663 for more information.)
R3767CH/3570A/3577A/4195A/4395A/4396B/8407A/8410A/8410B/8410C/8413A/8505A/85107B/85108A/85108L/8510A/8510B/8510C/8510E/8510SX/8711A/8711B/8711C/8712B/8712C/8712ET/8713B/8713C/8714B/8714C/8714ES/8714ET/8719A/8719C/8719D/8719ES/8719ET/8720A/8720B/8720C/8720D/8720ES/8720ET/8722A/8722C/8722D/8722ES/8722ET/8752A/8752B/8752C/8753A/8753B/8753C/8753D/8753E/8753ES/8756A/8757A/8757D/8757E/E5061A/E5061B/E5062A/E5070A/E5070B/E5071A/E5071B/E5071C/E5072A/E5100A/E5100B/E8356A/E8357A/E8358A/E8361A/E8361C/E8362A/E8362B/E8362C/E8363A/E8363B/E8363C/E8364A/E8364B/E8364C/E8801A/E8802A/E8803A/N3381A/N3382A/N3383A/N5221A/N5222A/N5230A/N9912A/N9913A/N9914A/N9915A/N9916A/N9917A/N9918A/N9923A/37217B/37225B/37247B/37247C/37247D/37269B/37269C/37269D/37297C/37317A/37325A/37347A/37347C/37347D/37369A/37369C/37369D/37377D/37397A/37397C/37397D/54107A/54109A/54111A/54117A/54119A/54130A/54131A/54136A/54137A/54147A/54161A/54169A/54177A/56100A/MS2024A/MS2026A/MS2034A/MS2036A/MS4622A/MS4622B/MS4622C/MS4623A/MS4623B/MS4623C/MS4623D/MS4624A/MS4624B/MS4624C/MS4624D/MS4642A/MS4642B/MS4644A/MS4644B/MS4645A/MS4645B/MS4647A/MS4647B/S112/S113/S113A/S120A/S235A/S250A/S251A/S251B/S251C/S311D/S312D/S330A/S331/S331A/S810A/S810C/S810D/S818A/S820A/S820C/S820D/PLANAR 304-1/PLANAR R140/PLANAR R54/S5048/TR5048/NA7100A/NA7100B/NA7300A/NA7300B/2810/PXI-5660/ZVA24.26/ZVA40/ZVA8.10/ZVB20/ZVB4/ZVB8/ZVH4/ZVH8/ZVK/ZVL13/ZVL3/ZVL3-75/ZVL6/ZVM/360B